
Bass diffusion of innovation on a network#
Field: energy · Zoo name: bass_diffusion · Module: modelly.zoo.bass_diffusion.model
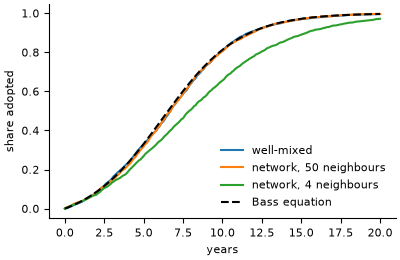
Households adopt an innovation, rooftop solar panels for instance. In each step of length
dt years a household that has not adopted does so with probability
(innovation + imitation * share) * dt, where innovation (Bass’s p) is the pull of
advertising and imitation (Bass’s q) the pull of the households it knows. share is the
share of adopters among everybody (mixing="well-mixed", Bass’s original model) or among the
household’s neighbours in a random network of mean degree degree (mixing="network").
How it is written#
Households are Household agents with an adopted Column; a step is one
ColumnTable.draw for the whole population. The network is a one-layer
MultilayerNetwork (see Networks), so the share of adopting neighbours
of every household is one sparse product, adjacency() @ adopted, divided by the degrees.
from modelly.zoo.bass_diffusion.model import BassDiffusion, BassScenario, bass_curve

model = BassDiffusion(BassScenario(rng=42, mixing="network", degree=8))
model.run()
frame = model.datacollector.get_model_vars_dataframe()  # time (years), adoption share
bass_curve(frame["time"], 0.03, 0.38)  # the well-mixed Bass solution
Parameter |
Default |
Meaning |
|---|---|---|
|
|
number of households |
|
|
Bass |
|
|
Bass |
|
|
step length, years |
|
|
|
|
|
mean number of neighbours in the random network |
|
|
run length of |
Validation#
In the well-mixed limit the expected adoption share follows the Bass equation
dF/dt = (p + q F)(1 - F), solved by
F(t) = (1 - exp(-(p + q) t)) / (1 + (q / p) exp(-(p + q) t)) (bass_curve).
tests/zoo/test_bass_diffusion.py checks, with three seeds, that the simulated share is within
the Euler discretisation error (the step recursion against the exact solution) plus five
standard deviations of the ODE at every step. The standard deviation comes from the linear
noise approximation: each step adds binomial noise of variance (1 - F) h (1 - h) / N, with
h = (p + q F) dt, and a deviation grows by 1 + f'(F) per step. It also checks that a dense
network (50 neighbours) stays within the same bound, that a sparse one (4 neighbours) lags the
well-mixed curve at mid-diffusion, because non-adopters cluster together, and that the same
seed gives the same curve.
References#
Bass, F. M. (1969). A new product growth for model consumer durables. Management Science, 15(5), 215-227.
Start a project from it with modelly zoo copy bass_diffusion my_diffusion.