
Age-structured SEIR with contact matrices#
Field: epidemiology · Zoo name: age_seir · Module: modelly.zoo.age_seir.model
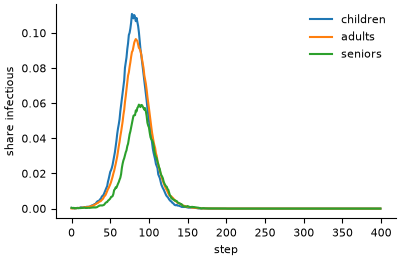
People are split into age groups and are susceptible, exposed, infectious or recovered. A
susceptible of group a is infected in one step with probability
1 - exp(-beta * sum_b C[a, b] * I_b / N_b), where C[a, b] is the mean number of contacts
a member of a has with members of b per step. Exposed people become infectious with
probability incubation per step, infectious people recover with probability recovery.
How it is written#
Everybody in the same group and state faces the same probabilities, so the population is a
CohortTable with one row per (group, state), and each transition is one binomial draw per
row. That has exactly the law of one draw per person (see
Vectorised step phases), and a population of a million costs the
same as one of a hundred. A contact matrix measured on a synthetic population comes from
modelly.space.networks.contact_matrix; see Networks.
from modelly.zoo.age_seir.model import AgeSEIR, SEIRScenario

model = AgeSEIR(SEIRScenario(rng=42))
model.run()
model.r0(), model.attack_rate(), model.final_size()
model.datacollector.get_model_vars_dataframe()  # S, E, I, R per step
Parameter |
Default |
Meaning |
|---|---|---|
|
|
people per age group (children, adults, seniors) |
|
3 x 3, reciprocal |
|
|
|
transmission probability per contact |
|
|
probability per step that an exposed person becomes infectious |
|
|
probability per step that an infectious person recovers |
|
|
infectious people per group at the start |
|
|
run length of |
The default contact matrix is illustrative, not survey data.
Validation#
Summing the force of infection over the whole epidemic gives the final-size relation
log(s_a) = log(s0_a) - (beta / recovery) * sum_b C[a, b] * (1 - s_b), where s_a is the
share of group a never infected. With one group it is the Kermack-McKendrick relation
s = s0 * exp(-R0 * (1 - s)), with R0 = beta * C / recovery. final_size() solves it.
tests/zoo/test_age_seir.py runs a homogeneous population of 200,000, written both as one
group and as three equal groups, with three seeds, and checks the simulated attack rate is
within five standard deviations of the final-size relation, the standard deviation coming
from the central limit theorem for the final size (Andersson and Britton). It also checks the
three age groups against the multi-group relation, that an outbreak with R0 < 1 stays small,
that nobody is created or lost, and that the same seed gives the same epidemic curve.
References#
Kermack, W. O. and McKendrick, A. G. (1927). A contribution to the mathematical theory of epidemics. Proceedings of the Royal Society A, 115, 700-721.
Mossong, J. et al. (2008). Social contacts and mixing patterns relevant to the spread of infectious diseases. PLoS Medicine, 5(3), e74.
Andersson, H. and Britton, T. (2000). Stochastic Epidemic Models and Their Statistical Analysis. Lecture Notes in Statistics 151, Springer.
Start a project from it with modelly zoo copy age_seir my_epidemic.