
Economics: where inequality comes from#
Two zoo models give two very different answers to “why is wealth unequal?”. In the Boltzmann exchange agents are identical and trade one unit of money at random: inequality comes from chance alone, and settles at a Gini of about one half. In the Bouchaud-Mezard model wealth also earns random returns: the richer earn more in absolute terms, and the distribution grows a power-law tail whose weight depends on how much the agents trade with each other.
Start a project from either with modelly zoo copy kinetic_wealth my_economy (the same
command in bash and PowerShell).
Build and run: chance alone#
A thousand agents start with five units each. Every step, each agent is paired with another and one of the two, chosen by a coin, gives one unit if it has one.
import numpy as np
import matplotlib.pyplot as plt

from modelly.zoo.kinetic_wealth.model import KineticScenario, KineticWealth

model = KineticWealth(KineticScenario(rng=1, n=1000, money=5, steps=600))
model.run()
gini = model.datacollector.get_model_vars_dataframe()
print(f"Gini after {model.scenario.steps} steps: {gini.iloc[-1, 0]:.3f}")
print(f"Gini of the stationary law:        {model.stationary_gini():.3f}")
Gini after 600 steps: 0.558
Gini of the stationary law:        0.545
Plot: the Boltzmann-Gibbs distribution#
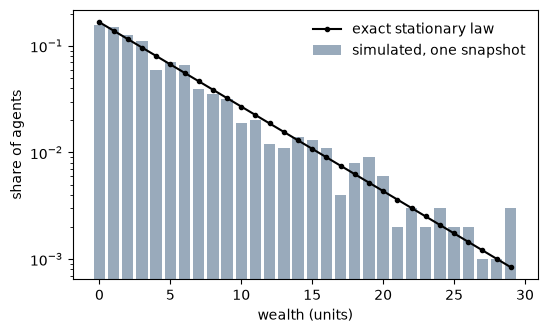
Every configuration of the money with the same total is equally likely in the long run, so
the wealth of one agent follows a distribution close to the exponential, P(w) ~ exp(-w / 5).
exact = model.stationary_distribution()
counts = np.bincount(model.wealth, minlength=exact.shape[0]) / model.scenario.n
fig, ax = plt.subplots(figsize=(6, 3.5))
ax.bar(np.arange(30), counts[:30], color="#9ab", label="simulated, one snapshot")
ax.plot(np.arange(30), exact[:30], "k.-", label="exact stationary law")
ax.set_yscale("log")
ax.set_xlabel("wealth (units)")
ax.set_ylabel("share of agents")
ax.legend(frameon=False);
Analysis: returns on wealth create a heavy tail#
In the Bouchaud-Mezard model each agent’s wealth is multiplied by a random return of
volatility sigma and flows toward the mean at rate J. The stationary distribution of
wealth relative to the mean is inverse-gamma with shape 1 + 2 J / sigma^2: the larger
sigma^2 / J, the heavier the tail and the higher the Gini.
from modelly.zoo.bouchaud_mezard.model import BouchaudMezard, BouchaudMezardScenario

fig, ax = plt.subplots(figsize=(6, 3.5))
for ratio in (0.5, 1.0, 1.5):
    bm = BouchaudMezard(BouchaudMezardScenario(rng=2, n=2000, volatility=np.sqrt(ratio), steps=1500))
    bm.run()
    w = np.sort(bm.wealth)[::-1]
    share = np.arange(1, w.shape[0] + 1) / w.shape[0]
    ax.loglog(w, share, label=f"sigma^2/J = {ratio}, Gini {bm.datacollector.get_model_vars_dataframe().iloc[-1, 0]:.2f}")
ax.set_xlabel("wealth relative to the mean")
ax.set_ylabel("share of agents at least this rich")
ax.legend(frameon=False);
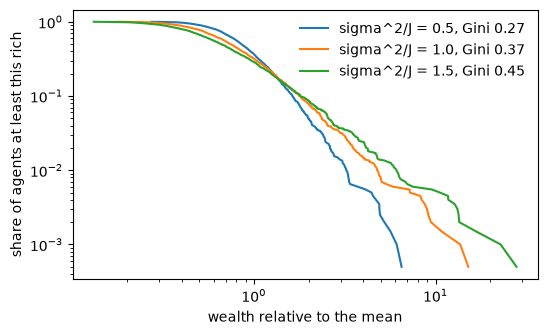
On a log-log plot the tail of the inverse-gamma law is a straight line of slope
-2 J / sigma^2: richer agents are much more common than in the Boltzmann world.
Going further#
Give the agents a saving propensity in the Boltzmann exchange and watch the Gini fall.
Make
Ja network: exchange only with trading partners.The order book is the zoo’s market-microstructure model: its returns have fat tails too, for a different reason.