
Ecology: fire on a landscape, and populations that feed themselves#
Two zoo models, two classic questions of landscape and population ecology. In the forest fire a fire spreads from tree to neighbouring tree: does it cross the whole landscape? In the energy-budget population foragers eat, pay a metabolic cost, reproduce and starve: how many of them can the landscape feed?
Start a project from either with modelly zoo copy forest_fire my_forest (the same command
in bash and PowerShell).
Build and run: a fire#
A 100 x 100 raster; each cell holds a tree with probability density. The west edge is set
alight, and every step the fire moves to the four neighbours of every burning tree.
import numpy as np
import matplotlib.pyplot as plt

from modelly.zoo.forest_fire.model import Cover, ForestFire, ForestScenario

model = ForestFire(ForestScenario(rng=4, density=0.6))
model.run()
print(f"burnt {model.burnt_share():.0%} of the trees in {int(model.time)} steps; "
      f"reached the east edge: {model.spans()}")
burnt 68% of the trees in 245 steps; reached the east edge: True
Plot: the burnt landscape#
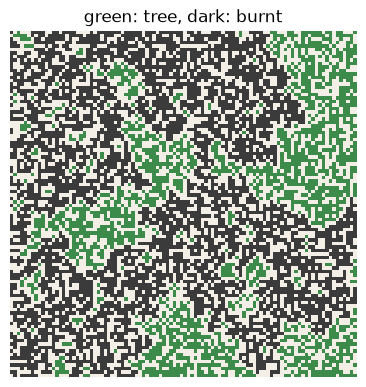
model.layer is the state raster, shaped like the grid; the burnt patch has the ragged
outline of a percolation cluster.
from matplotlib.colors import ListedColormap

colours = ListedColormap(["#f3efe6", "#3d8b4a", "#e8731a", "#3b3b3b"])
fig, ax = plt.subplots(figsize=(4.5, 4.5))
ax.imshow(model.layer.T, origin="lower", cmap=colours, vmin=0, vmax=len(Cover) - 1)
ax.set_title("green: tree, dark: burnt")
ax.set_axis_off()
Analysis: the percolation threshold#
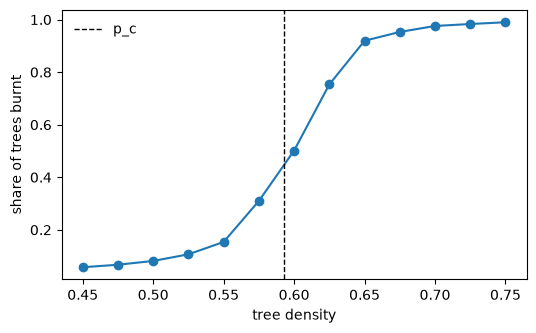
The burnt share jumps from almost nothing to almost everything around the site-percolation
threshold of the square lattice, p_c = 0.5927. Five seeds per density:
def burnt_share(density, seed):
    fire = ForestFire(ForestScenario(rng=seed, width=60, height=60, density=density))
    fire.run()
    return fire.burnt_share()


densities = np.linspace(0.45, 0.75, 13)
burnt = [np.mean([burnt_share(d, seed) for seed in range(5)]) for d in densities]
fig, ax = plt.subplots(figsize=(6, 3.5))
ax.plot(densities, burnt, marker="o")
ax.axvline(0.592746, color="k", ls="--", lw=1, label="p_c")
ax.set_xlabel("tree density")
ax.set_ylabel("share of trees burnt")
ax.legend(frameon=False);
A real landscape is not uniform: pass a per-cell probability of tree cover as cover, for
example the values of a land-cover raster read with modelly.space.geo.RasterLayer.
A population at its carrying capacity#
In the energy-budget model the resource flows into every cell at a constant rate. At
equilibrium the energy the foragers assimilate equals the energy they spend, which gives the
carrying capacity K = efficiency * inflow * cells / cost.
from modelly.zoo.energy_budget.model import EnergyBudget, EnergyScenario

fig, ax = plt.subplots(figsize=(6, 3.5))
for inflow in (0.5, 1.0):
    population = EnergyBudget(EnergyScenario(rng=1, inflow=inflow))
    population.run()
    series = population.datacollector.get_model_vars_dataframe()["foragers"]
    line, = ax.plot(series, label=f"inflow {inflow}: mean {series[150:].mean():.0f}")
    ax.axhline(population.carrying_capacity(), color=line.get_color(), ls="--", lw=1)
ax.set_xlabel("step")
ax.set_ylabel("foragers")
ax.legend(frameon=False);
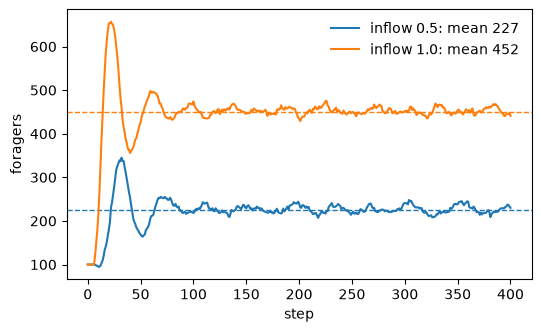
The dashed lines are K: after the first boom and bust, the population settles on it.
Going further#
Turn on succession (
growthandlightning) and look for the power-law fire sizes of the Drossel-Schwabl model.Give the foragers a maximum age, and see how
Kchanges.Put a fire on the foragers’ landscape: burnt cells grow no resource for a while.