
Energy: how rooftop solar spreads#
The Bass model is the standard description of how a new technology spreads: some households
adopt because of advertising and subsidies (the innovation coefficient p), most because
people they know have adopted (the imitation coefficient q). This tutorial runs the
Bass diffusion model from the zoo, compares it with the Bass
equation and asks how much the structure of a social network slows adoption down.
Start your own project from it with modelly zoo copy bass_diffusion my_solar (the same
command in bash and PowerShell).
Build and run#
Five thousand households; a step is a tenth of a year. With mixing="well-mixed" every
household sees the adoption share of the whole population, as in Bass’s original model.
import numpy as np
import matplotlib.pyplot as plt

from modelly.zoo.bass_diffusion.model import BassDiffusion, BassScenario, bass_curve

scenario = BassScenario(rng=3, households=5000, innovation=0.03, imitation=0.38)
model = BassDiffusion(scenario)
model.run()
frame = model.datacollector.get_model_vars_dataframe()
frame.iloc[::40]
| time | adoption | |
|---|---|---|
| 0 | 0.0 | 0.0000 |
| 40 | 4.0 | 0.2370 |
| 80 | 8.0 | 0.6456 |
| 120 | 12.0 | 0.9054 |
| 160 | 16.0 | 0.9812 |
| 200 | 20.0 | 0.9948 |
Plot: the S-curve against the Bass equation#
years = frame["time"].to_numpy()
fig, ax = plt.subplots(figsize=(6, 3.5))
ax.plot(years, frame["adoption"], label="agent-based, well mixed")
ax.plot(years, bass_curve(years, 0.03, 0.38), "k--", label="Bass equation")
ax.set_xlabel("years")
ax.set_ylabel("share of households adopted")
ax.legend(frameon=False);
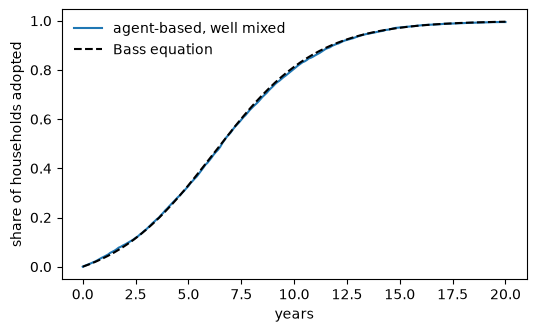
The yearly number of new adopters peaks at t* = ln(q / p) / (p + q):
new = np.diff(frame["adoption"].to_numpy()) / scenario.dt
print(f"peak of the simulated adoption rate: {years[1:][np.argmax(new)]:.1f} years")
print(f"Bass prediction:                     {np.log(0.38 / 0.03) / 0.41:.1f} years")
peak of the simulated adoption rate: 6.6 years
Bass prediction:                     6.2 years
Analysis: does the network matter?#
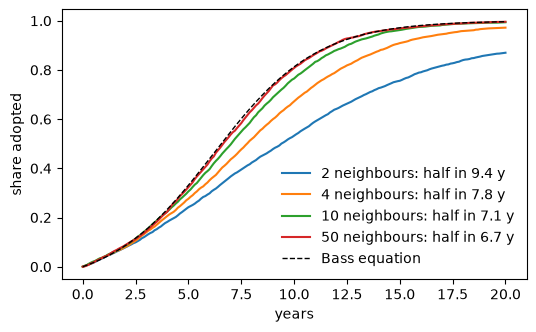
On a random network each household sees only its neighbours. With few neighbours, clusters of non-adopters see fewer adopters than the population average, and imitation is slower.
fig, ax = plt.subplots(figsize=(6, 3.5))
for degree in (2, 4, 10, 50):
    network = BassDiffusion(BassScenario(rng=3, mixing="network", degree=degree))
    network.run()
    curve = network.datacollector.get_model_vars_dataframe()
    half = curve["time"][curve["adoption"] >= 0.5].iloc[0]
    ax.plot(curve["time"], curve["adoption"], label=f"{degree} neighbours: half in {half:.1f} y")
ax.plot(years, bass_curve(years, 0.03, 0.38), "k--", lw=1, label="Bass equation")
ax.set_xlabel("years")
ax.set_ylabel("share adopted")
ax.legend(frameon=False);
Going further#
Read a real social network with
modelly.space.networks.read_edge_list.Make
innovationdepend on a subsidy that starts in a given year.Calibrate
pandqon an adoption series by least squares onbass_curve.