
Epidemiology: who gets infected, and how many#
How many people will an epidemic infect, and in which age groups? This tutorial runs the age-structured SEIR model from the zoo, checks it against the final-size relation, and uses the contact matrix to compare two interventions.
Start a project from it with modelly zoo copy age_seir my_epidemic (the same command in
bash and PowerShell).
Build and run#
A hundred thousand people in three age groups. contacts[a][b] is the mean number of
contacts a member of group a has with members of group b per day; it is reciprocal, so
N[a] * C[a, b] == N[b] * C[b, a]. In a real study it comes from a contact survey, or from a
synthetic population through modelly.space.networks.contact_matrix.
import numpy as np
import matplotlib.pyplot as plt

from modelly.zoo.age_seir.model import AgeSEIR, SEIRScenario, State

GROUPS = ("children", "adults", "seniors")
scenario = SEIRScenario(rng=42)
model = AgeSEIR(scenario)
print(f"R0 = {model.r0():.2f}")
model.run()
model.datacollector.get_model_vars_dataframe().iloc[::50]
R0 = 2.17
| S | E | I | R | |
|---|---|---|---|---|
| 0 | 99970 | 0 | 30 | 0 |
| 50 | 92602 | 2032 | 1747 | 3619 |
| 100 | 27623 | 2457 | 4600 | 65320 |
| 150 | 22360 | 34 | 69 | 77537 |
| 200 | 22323 | 1 | 0 | 77676 |
| 250 | 22323 | 0 | 0 | 77677 |
| 300 | 22323 | 0 | 0 | 77677 |
| 350 | 22323 | 0 | 0 | 77677 |
| 400 | 22323 | 0 | 0 | 77677 |
The population is a table of cohorts, one row per (age group, state), so the run costs the same for a hundred thousand people as for a hundred:
model.people.to_dataframe()
| count | group | state | |
|---|---|---|---|
| 0 | 2187 | 0 | 0 |
| 1 | 17813 | 0 | 3 |
| 2 | 10883 | 1 | 0 |
| 3 | 49117 | 1 | 3 |
| 4 | 9253 | 2 | 0 |
| 5 | 10747 | 2 | 3 |
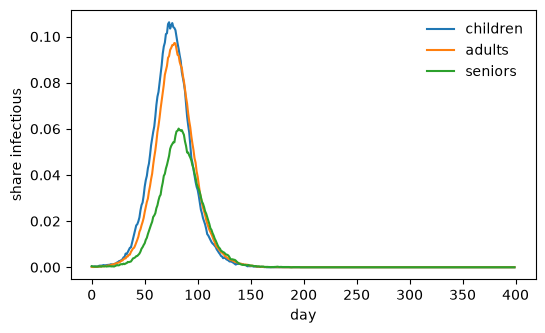
Plot: the epidemic curve#
model = AgeSEIR(scenario)
infectious = []
for _ in range(scenario.steps):
    model.step()
    infectious.append(model.counts()[:, State.I] / model.sizes)
fig, ax = plt.subplots(figsize=(6, 3.5))
ax.plot(np.array(infectious), label=GROUPS)
ax.set_xlabel("day")
ax.set_ylabel("share infectious")
ax.legend(frameon=False);
Check: the final-size relation#
Over the whole epidemic the share s_a of group a that escapes infection solves
log(s_a) = log(s0_a) - (beta / recovery) * sum_b C[a, b] * (1 - s_b). final_size()
solves it; the simulated attack rates agree to within the sampling noise.
import pandas as pd

pd.DataFrame(
    {"simulated": model.attack_rate(), "final-size relation": model.final_size()},
    index=GROUPS,
).round(3)
| simulated | final-size relation | |
|---|---|---|
| children | 0.889 | 0.889 |
| adults | 0.815 | 0.815 |
| seniors | 0.541 | 0.538 |
Analysis: which intervention?#
Halving the contacts among children (closing schools) and halving every contact of the
seniors (shielding) reduce R0 differently, and protect different groups.
contacts = np.array(scenario.contacts)
schools = contacts.copy()
schools[0, 0] /= 2
shielding = contacts.copy()
shielding[2, :] /= 2
shielding[:, 2] /= 2
rows = {}
for label, matrix in {"none": contacts, "schools": schools, "shielding": shielding}.items():
    run = AgeSEIR(SEIRScenario(rng=42, contacts=tuple(map(tuple, matrix))))
    run.run()
    rows[label] = [run.r0(), *run.attack_rate()]
pd.DataFrame(rows, index=["R0", *GROUPS]).T.round(3)
| R0 | children | adults | seniors | |
|---|---|---|---|---|
| none | 2.165 | 0.891 | 0.819 | 0.537 |
| schools | 1.961 | 0.773 | 0.803 | 0.528 |
| shielding | 2.115 | 0.873 | 0.793 | 0.263 |
Going further#
Build the contact matrix from a synthetic population with households, schools and workplaces; see Networks and the layered epidemic example.
Make
betaa function of time to model a lockdown.Fit
betato an observed epidemic curve.